For food bloggers, the thrill of seeing a spike in blog traffic is unmatched. It’s a tangible sign that your recipes, stories, and visuals are resonating with an audience. But understanding why your traffic is growing—or stalling—requires more than a gut feeling. Enter Google Analytics (GA), a free, powerful tool that provides detailed insights into your blog’s performance. For beginners, GA’s dashboard can feel like a maze of numbers and graphs, but it doesn’t have to be. This guide breaks down the essentials of using Google Analytics to grow your food blog, focusing on key metrics, actionable strategies, and beginner-friendly tips to help you make data-driven decisions.
Why Google Analytics Matters for Food Bloggers
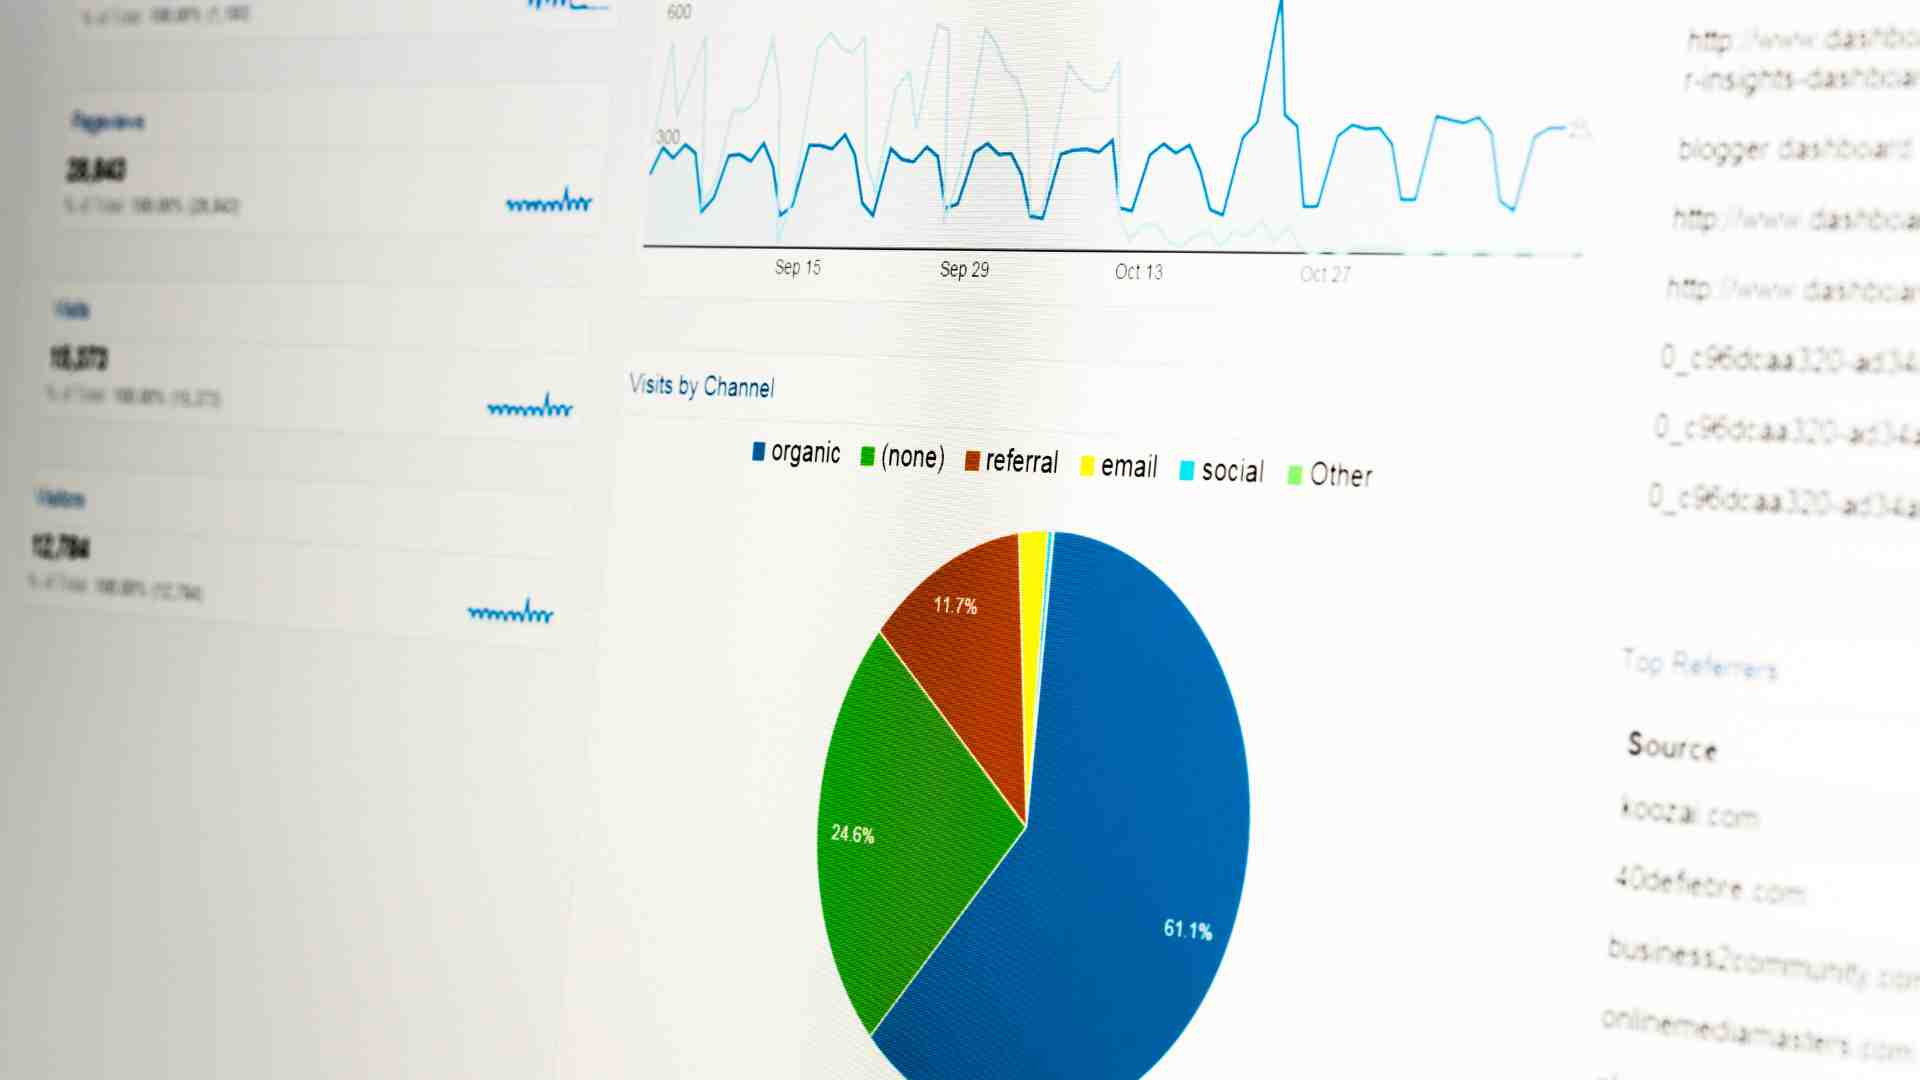
Google Analytics is like a GPS for your blog. It shows you where your readers are coming from, what they’re engaging with, and how they’re navigating your site. For food bloggers, this data is critical for several reasons:
- Validation and Feedback: Traffic spikes confirm that your content is connecting with readers, while dips can highlight areas for improvement.
- Content Strategy: GA reveals which recipes or topics perform best, helping you create more of what your audience loves.
- SEO and Monetization: Understanding traffic sources and user behavior can boost your search engine rankings and ad revenue.
- Engagement Optimization: Metrics like bounce rate and time on page show how engaging your content is, guiding you to refine your posts.
The challenge? GA offers a lot of data, and not all of it is relevant for beginners. This guide focuses on the metrics that matter most for food bloggers, with clear instructions on how to find them and use them to grow your blog.
Setting Up Google Analytics for Your Food Blog
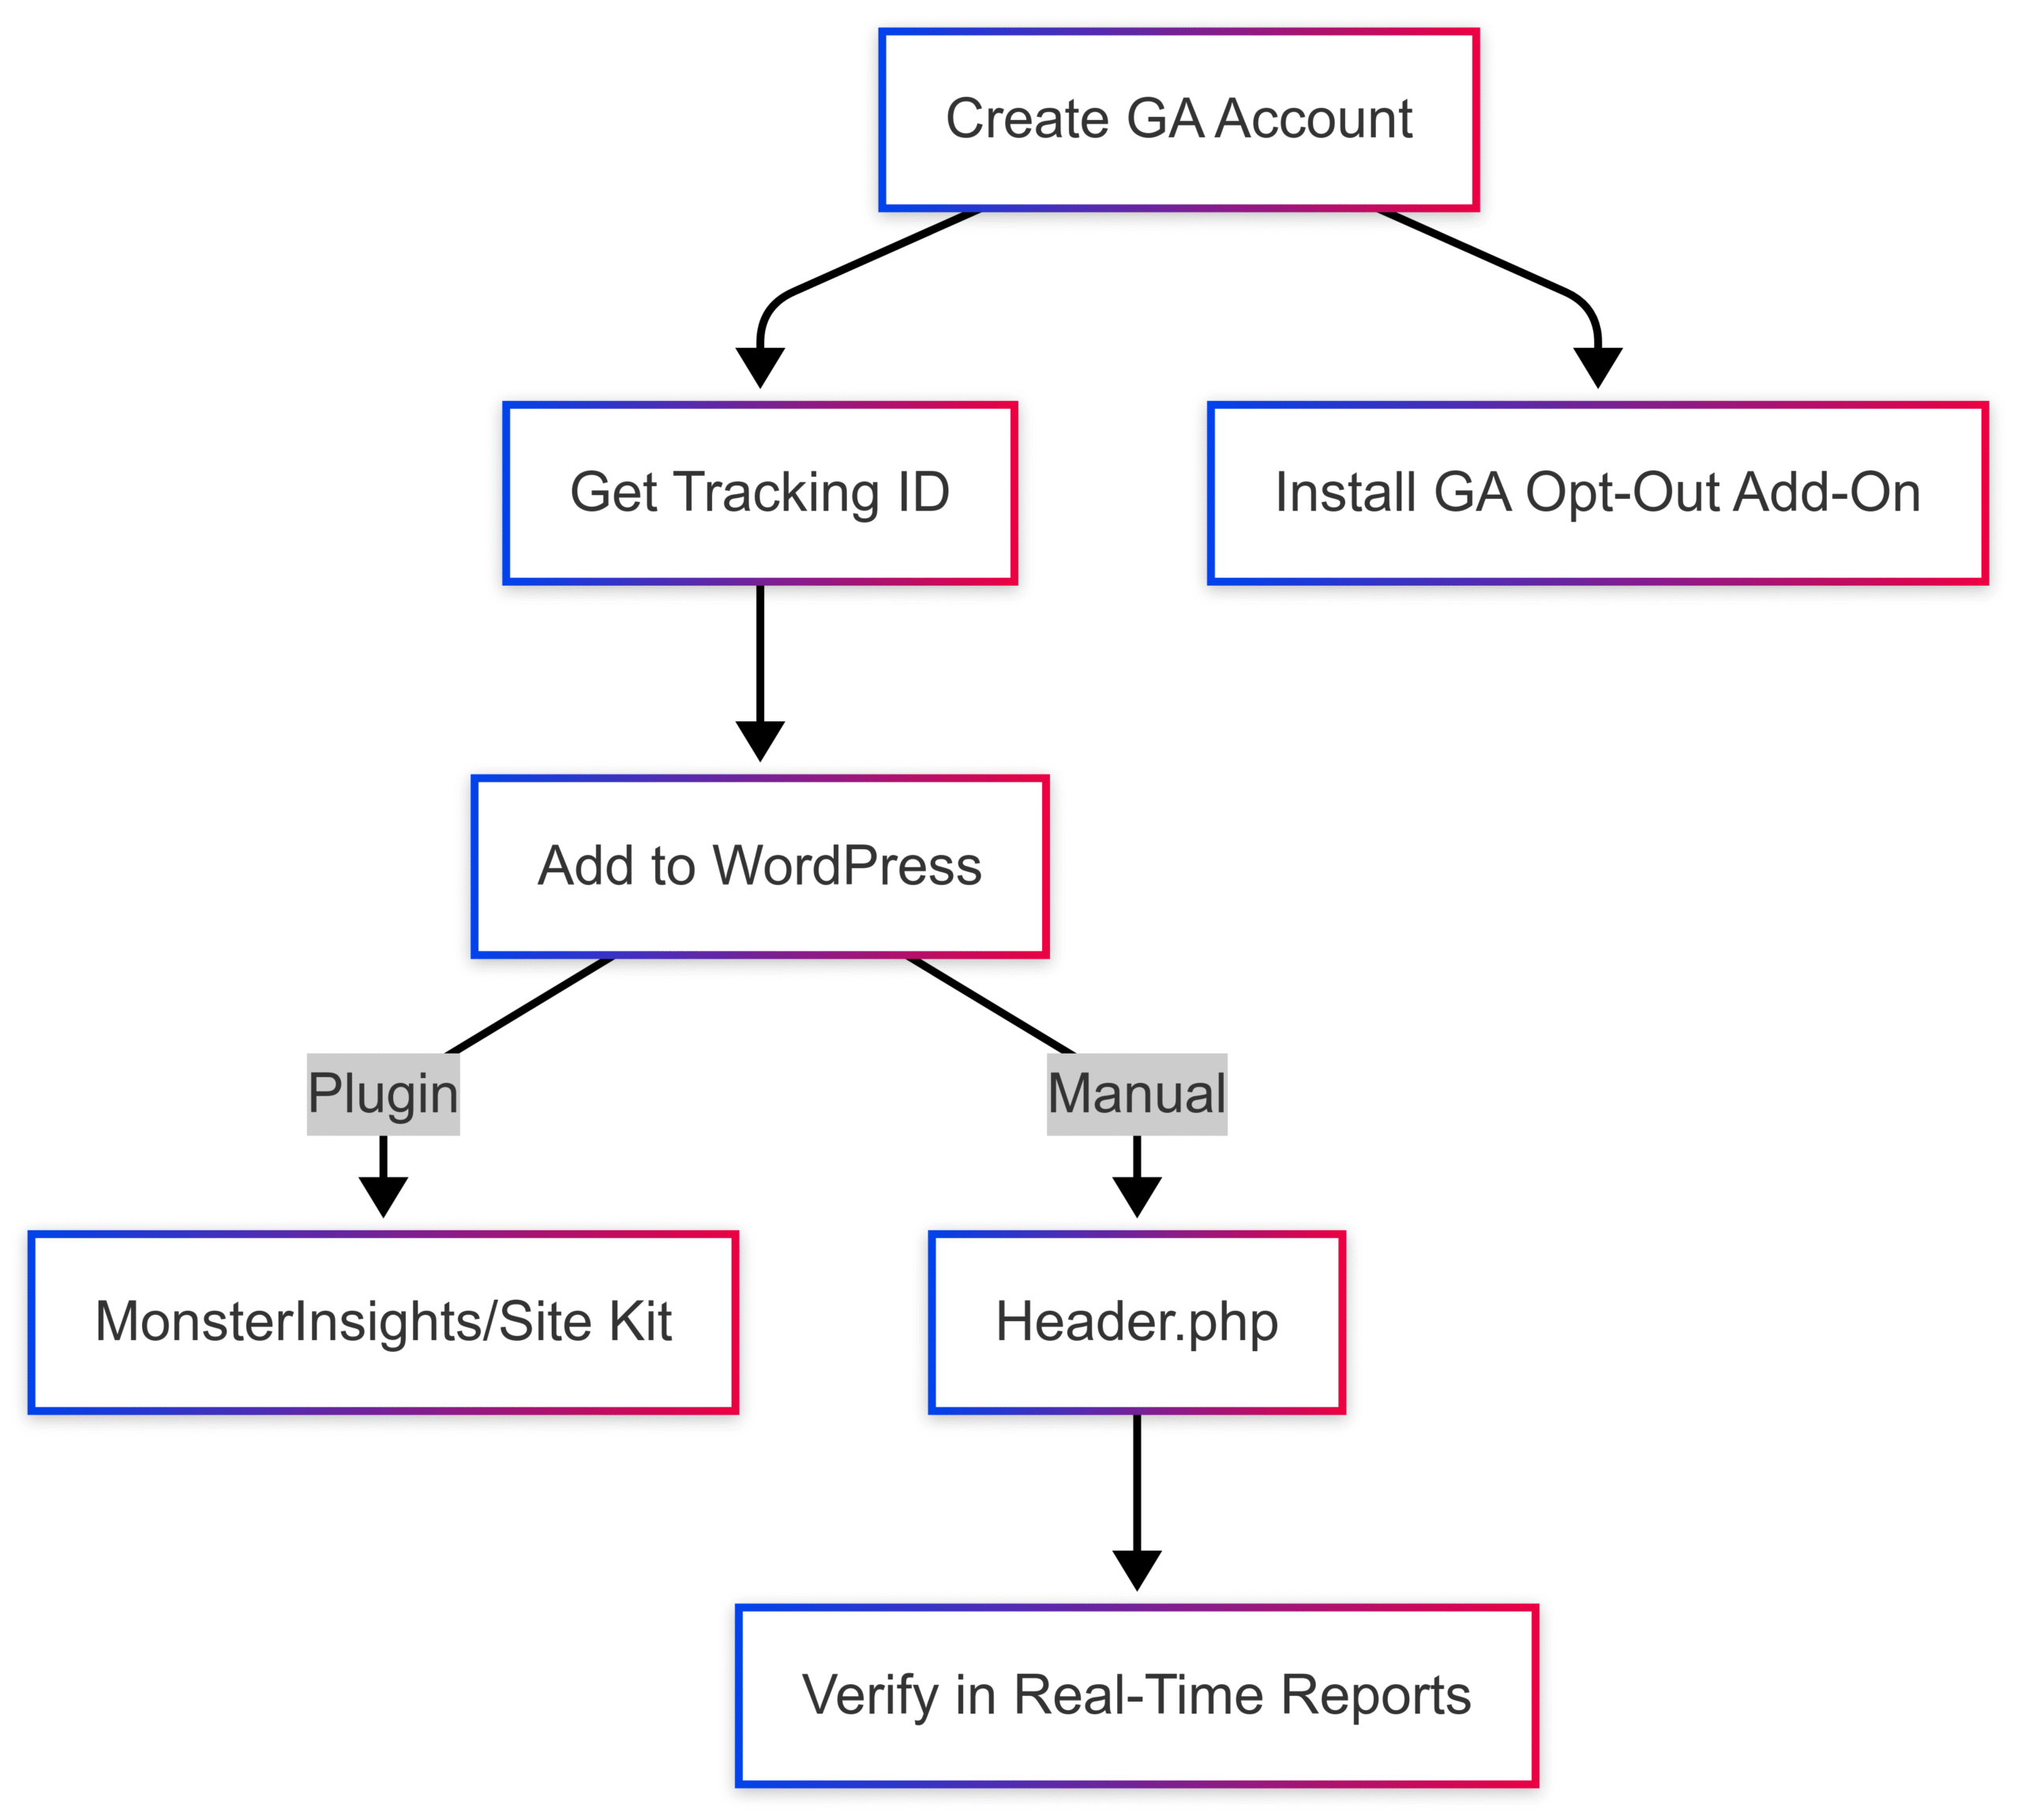
Before you can dive into the data, you need to connect Google Analytics to your blog. Here’s a step-by-step guide to get started, using a WordPress-based food blog as an example.
Step 1: Create a Google Analytics Account
- Visit analytics.google.com and sign in with your Google account.
- Click Start Measuring and follow the prompts to set up a new account.
- Enter an account name (e.g., “My Food Blog Analytics”).
- Create a Property for your blog by entering your blog’s name, URL, and industry category (select “Food & Drink”).
- GA will generate a Tracking ID (e.g., UA-XXXXX-X or G-XXXXX for GA4).
Step 2: Add the Tracking Code to Your Blog
- In GA, navigate to Admin > Property > Tracking Info > Tracking Code.
- Copy the Tracking ID or the full tracking code snippet.
- For WordPress blogs:
- Option 1: Plugin: Install a plugin like MonsterInsights or Site Kit by Google. Paste the Tracking ID in the plugin’s settings.
- Option 2: Manual: Add the tracking code to your theme’s
header.phpfile or use a custom functions plugin.
- Save changes and verify the setup by checking Real-Time reports in GA. Data should appear within 24–72 hours.
Step 3: Install the GA Opt-Out Browser Add-On
To avoid skewing your data by tracking your own visits, install the Google Analytics Opt-Out Browser Add-On. This is especially important for new blogs with low traffic, where your own page views can significantly distort metrics.

Key Google Analytics Metrics for Food Bloggers
Once GA is set up, it’s time to explore the metrics that will help you grow your food blog. Below are the five most important metrics for beginners, along with how to find them in GA and how to use them to optimize your blog.
1. Traffic Sources (Acquisition Channels)
What It Tells You: This metric shows where your readers are coming from—social media, search engines, direct visits, or referrals. For food bloggers, understanding traffic sources helps you prioritize platforms for promotion.
How to Find It: Reports > Acquisition > All Traffic > Channels
Insights:
- Social: High traffic from Pinterest or Instagram suggests your visual content is resonating. Double down on these platforms with optimized pins or stories.
- Organic Search: Traffic from Google indicates strong SEO. Analyze which keywords are driving clicks using GA’s Queries report (if linked with Google Search Console).
- Direct: Readers typing your URL directly are loyal fans. Encourage this with consistent branding and email newsletters.
- Referral: Links from other blogs or recipe sites can boost traffic and SEO. Reach out to these sites for collaborations.
Actionable Tip: If Pinterest drives 60% of your traffic, experiment with long pins or video pins to amplify results. If organic search is low, optimize your recipe posts with schema markup and keyword-rich headings.
Example Data Table:
| Channel | Sessions | % of Total Traffic | Avg. Session Duration |
|---|---|---|---|
| Social | 5,000 | 50% | 1:30 min |
| Organic Search | 3,000 | 30% | 2:15 min |
| Direct | 1,500 | 15% | 3:00 min |
| Referral | 500 | 5% | 1:45 min |
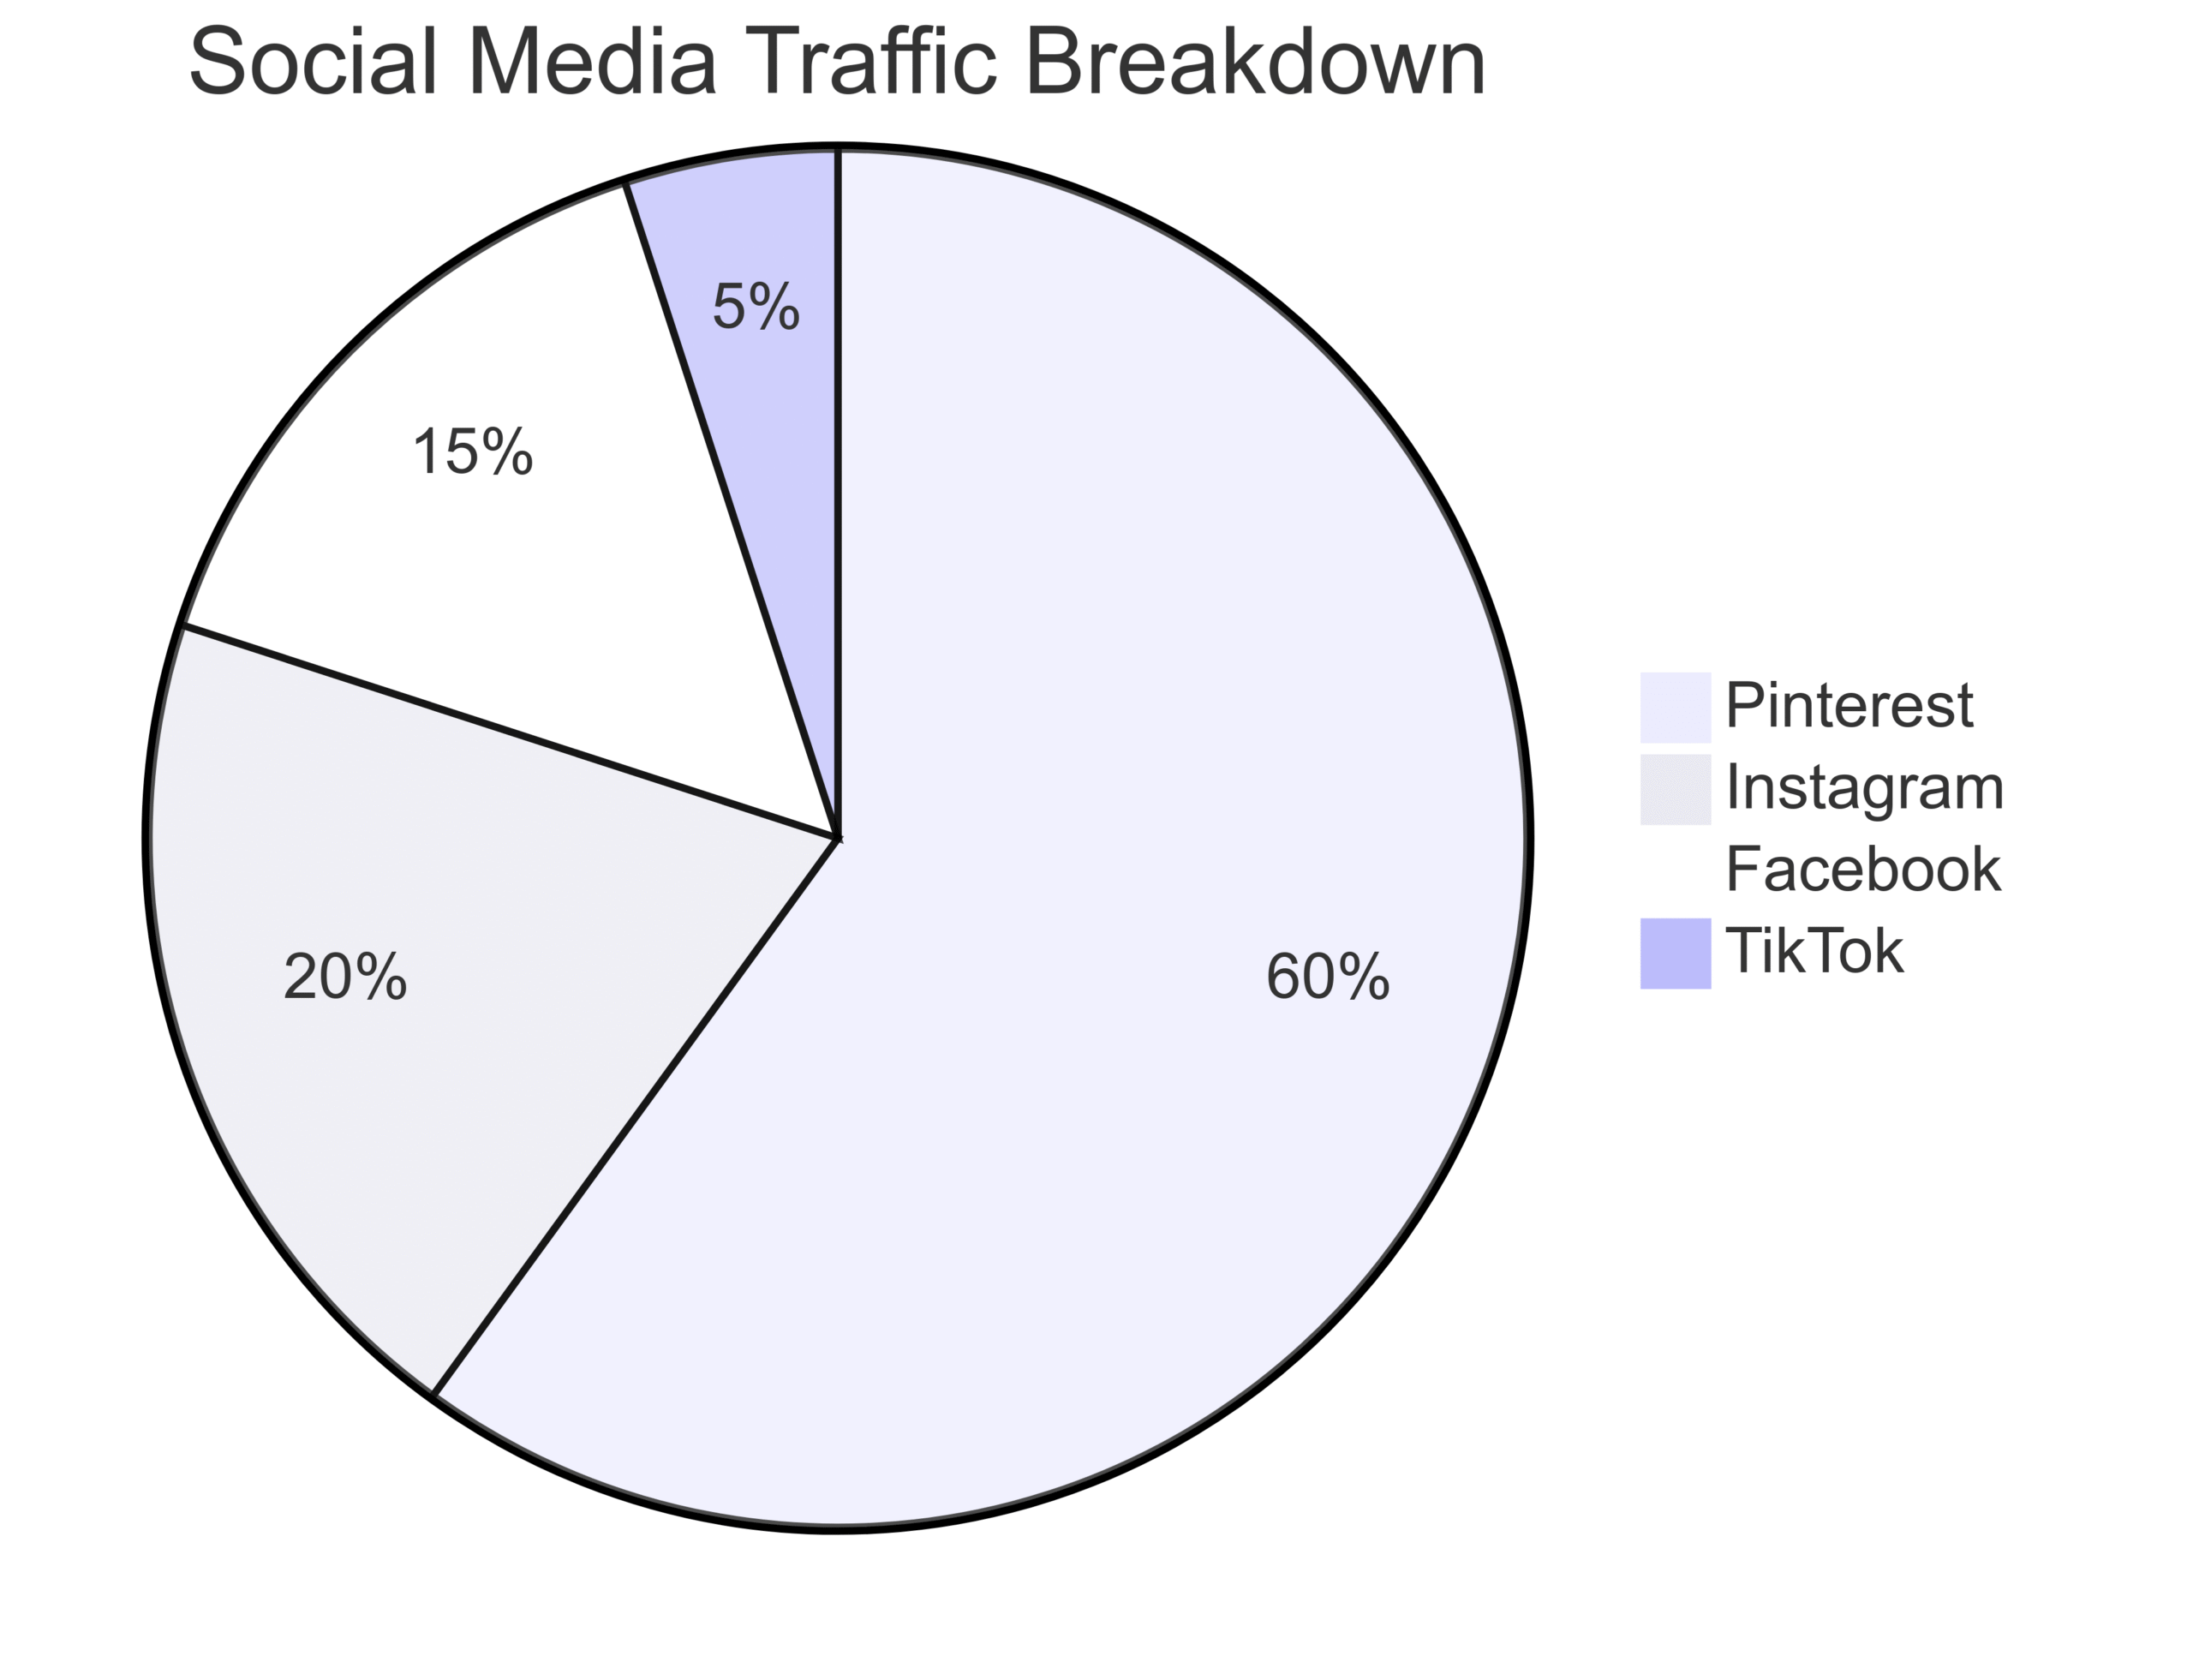
2. Social Media Traffic Breakdown
What It Tells You: This metric drills down into which social platforms are driving traffic, helping you focus your efforts on high-performing channels.
How to Find It: Reports > Acquisition > Channels > Social
Insights:
- If Pinterest drives 80% of social traffic, invest in pin design and scheduling tools like Tailwind.
- If Instagram traffic is low despite high engagement, add stronger CTAs in your bio or stories to drive clicks to your blog.
- Platforms like TikTok may show low traffic but high engagement for short recipe videos, indicating potential for growth.
Actionable Tip: Pick one or two platforms to master rather than spreading yourself thin. For example, if Pinterest is your top source, create 5–10 pins per recipe with varied designs and track their performance.
Mermaid Chart:

3. Site Content (Popular Pages)
What It Tells You: This report shows which pages or posts attract the most traffic, revealing what content resonates with your audience.
How to Find It: Reports > Behavior > Site Content > All Pages
Insights:
- A vegan lasagna recipe with 10,000 views suggests demand for plant-based dishes. Create similar recipes or a vegan recipe series.
- High-traffic pages are prime spots for email opt-ins, affiliate links, or ad placements to boost revenue.
- If a post like “30-Minute Dinners” performs well, analyze its structure (e.g., clear headings, step-by-step photos) and replicate it.
Actionable Tip: Add internal links from high-traffic posts to related recipes to increase session duration and reduce bounce rate.
Example Data Table:
| Page Title | Pageviews | Avg. Time on Page | Bounce Rate |
|---|---|---|---|
| Vegan Lasagna | 10,000 | 2:30 min | 45% |
| 30-Minute Dinners | 8,000 | 2:00 min | 50% |
| Chocolate Chip Cookies | 5,000 | 1:45 min | 55% |
4. Referral Path to Popular Pages
What It Tells You: This metric shows the exact links driving traffic to your top pages, helping you optimize external promotions.
How to Find It: Reports > Behavior > Site Content > All Pages > Secondary Dimension: Referral Path
Insights:
- If a Pinterest pin with a long image and text overlay drives 500 clicks to your cookie recipe, create more pins in that style.
- Referral traffic from a recipe aggregator like Foodgawker indicates your photos are clickable. Submit more recipes to similar platforms.
- Backlinks from high-authority sites (e.g., Bon Appétit) boost SEO. Reach out to these sites for guest posts or features.
Actionable Tip: Use referral data to refine your social media strategy. For example, if text-heavy pins perform poorly, focus on vibrant, image-driven designs.
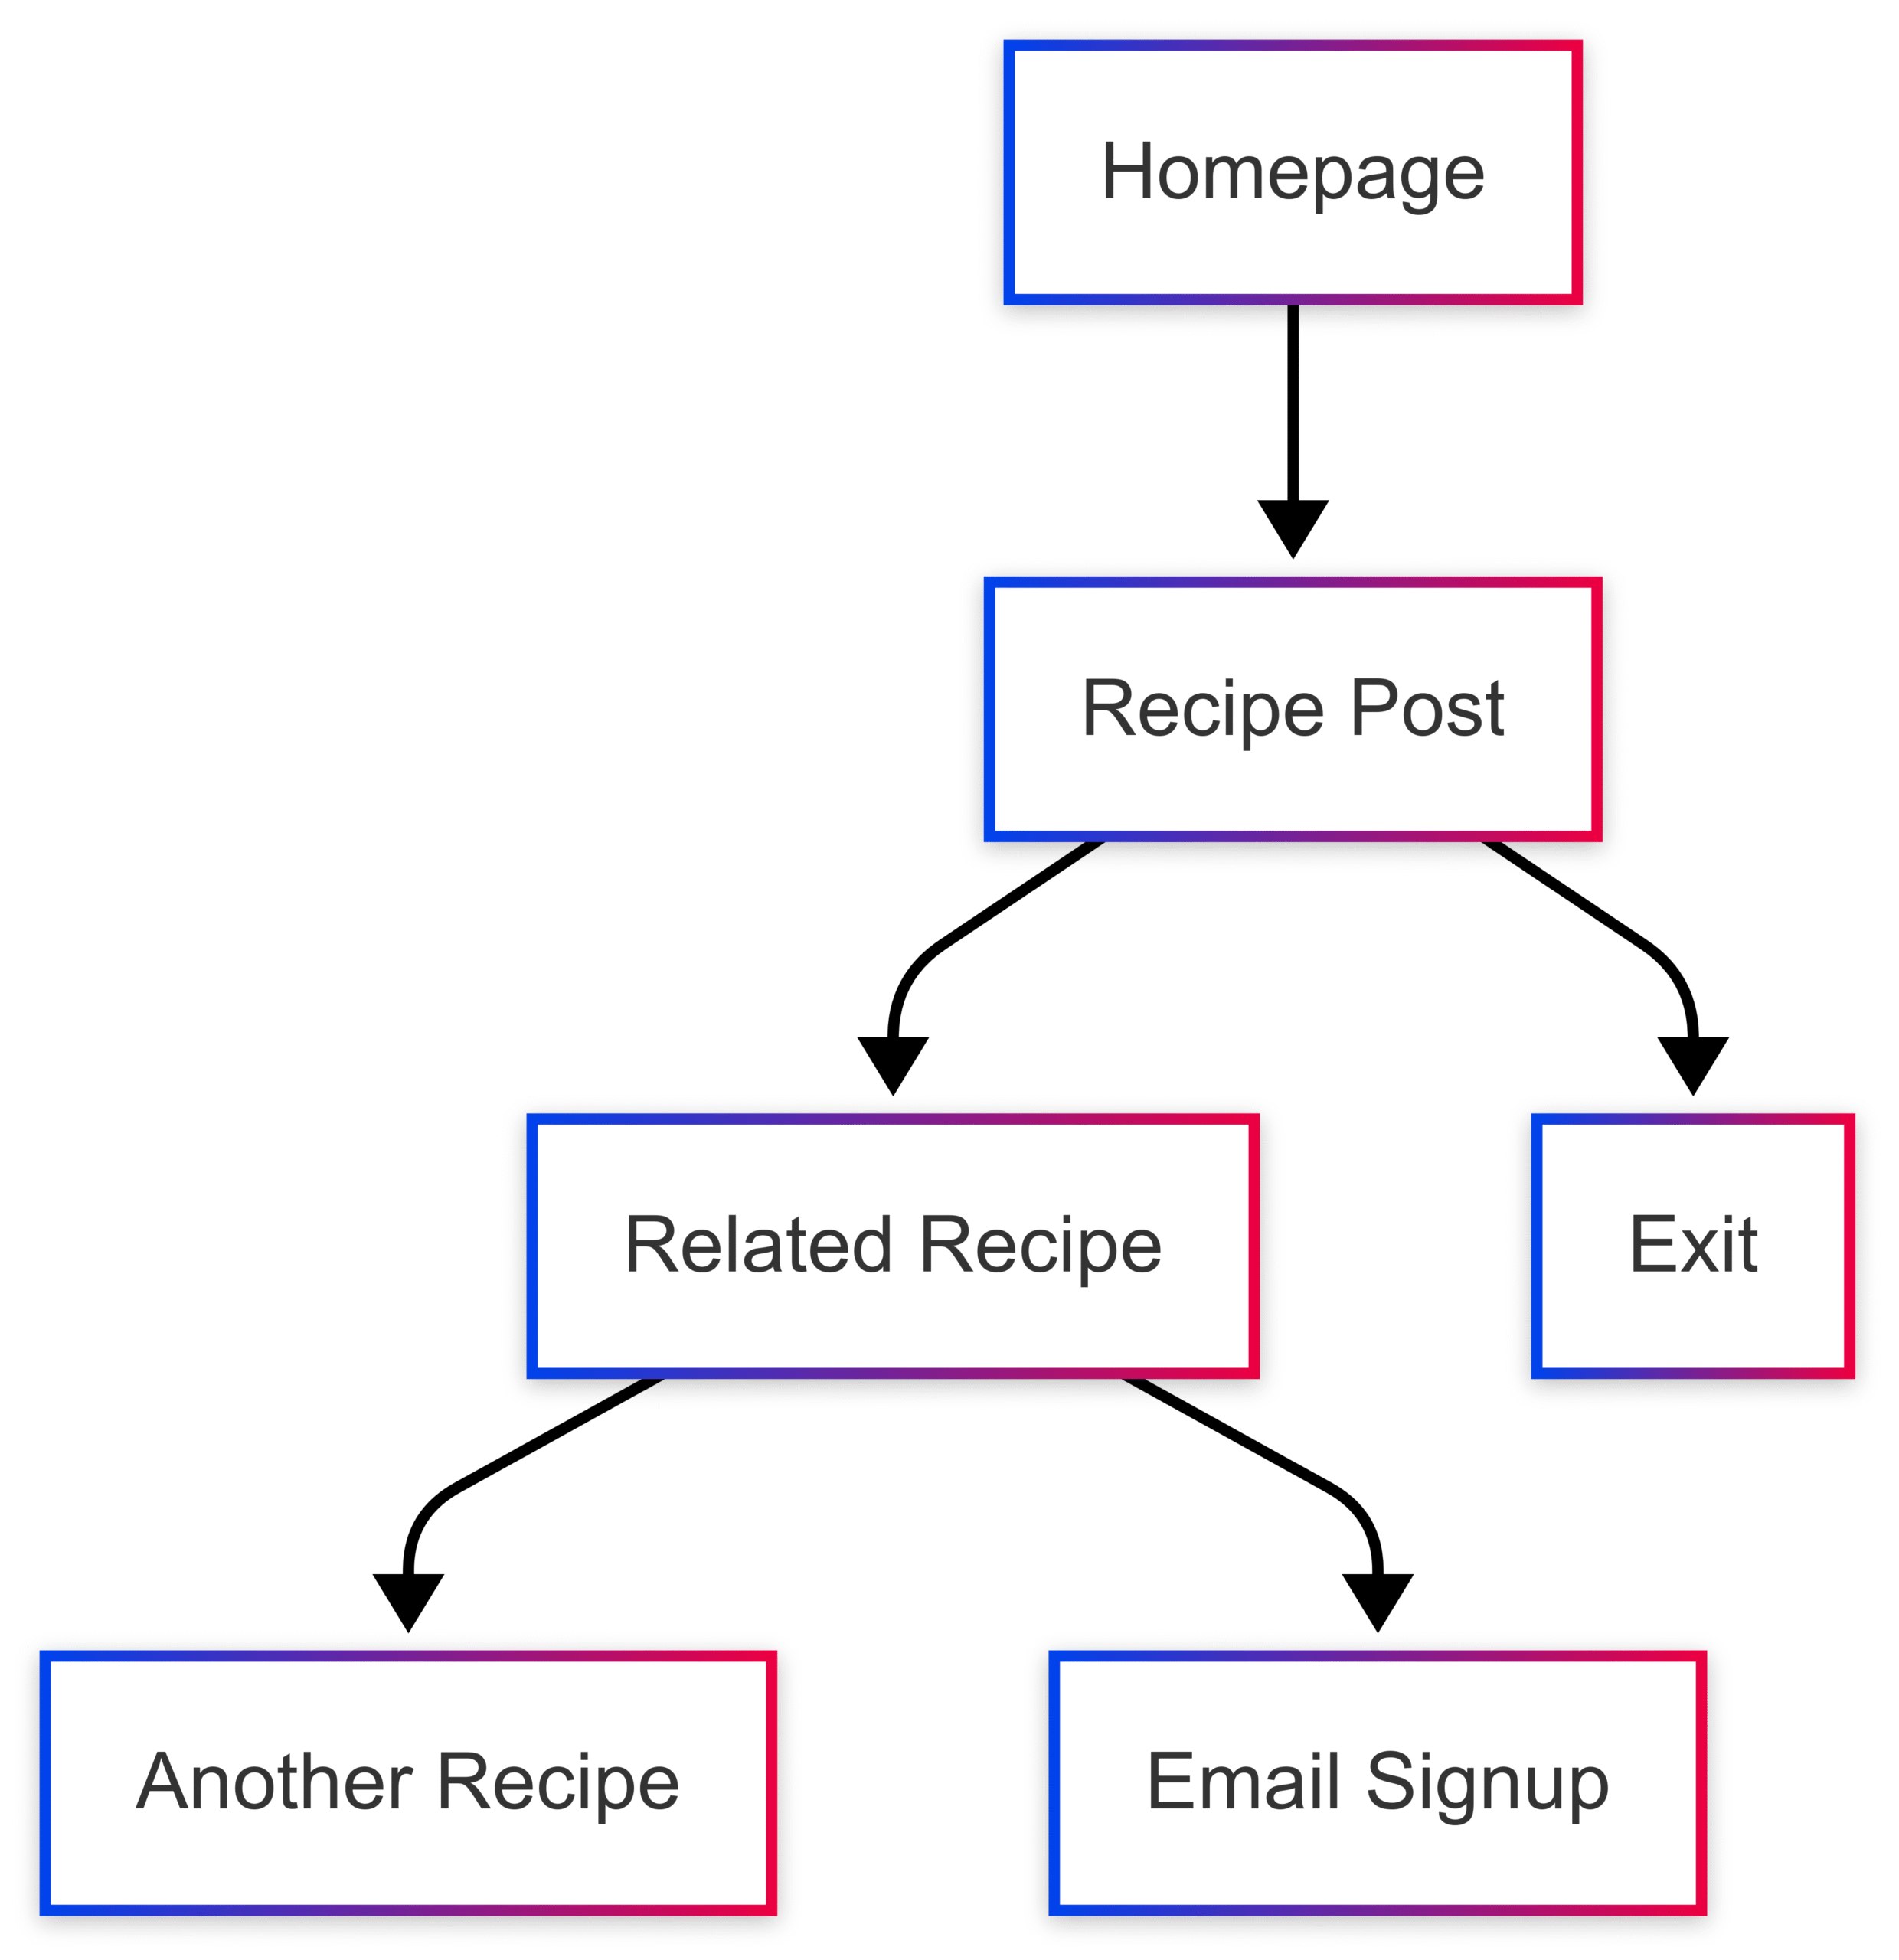
5. Reader Behavior Flow
What It Tells You: This report visualizes the path readers take through your site, showing whether they stick around or leave after one page.
How to Find It: Reports > Behavior > Behavior Flow
Insights:
- If readers visit a recipe and leave, your content may lack clear navigation or compelling CTAs.
- High drop-off rates after the homepage suggest weak internal linking or unappealing visuals.
- Readers exploring multiple recipes indicate strong engagement. Promote related recipes with “You Might Also Like” sections.
Actionable Tip: Add a “Jump to Recipe” button and related recipe links to keep readers engaged. Use tools like Recipe Kit to create interactive recipe cards with serving size adjusters and unit converters.
Mermaid Chart:

Additional Metrics to Monitor
Beyond the core metrics above, these additional KPIs can provide deeper insights into your blog’s performance:
Bounce Rate
What It Tells You: Bounce rate is the percentage of visitors who leave after viewing one page. A high bounce rate (above 50%) may indicate irrelevant content or slow load times, though recipe posts often have higher bounce rates as readers leave after getting the recipe.
How to Find It: Audience > Overview > Country
Actionable Tip: Reduce bounce rate by improving page speed (aim for under 2 seconds) and adding internal links to related content. Use tools like Jetpack Boost to optimize load times.
Page Speed
What It Tells You: Slow-loading pages increase bounce rates and hurt SEO. Google prioritizes sites that load in under 2 seconds.
How to Find It: Behavior > Site Speed > Overview
Actionable Tip: Compress images with tools like TinyPNG and enable a CDN (e.g., Jetpack’s Image CDN) to speed up your site.
Geographies
What It Tells You: This metric shows where your readers are located, helping you tailor content to their preferences.
How to Find It: Audience > Overview > Country
Actionable Tip: If 30% of your traffic comes from the UK, create recipes with metric measurements or British-inspired dishes like shepherd’s pie.
Backlinks
What It Tells You: Backlinks from other sites drive traffic and improve SEO. GA tracks social trackbacks, but tools like Ahrefs or Moz offer deeper insights.
How to Find It: Acquisition > Social > Trackbacks
Actionable Tip: Pitch guest posts to food blogs or recipe aggregators to earn high-quality backlinks.
Custom Alerts
What It Tells You: Custom alerts notify you when specific criteria are met, like a traffic spike or increased page load time.
How to Set Up: Admin > View > Custom Alerts > Create New Alert
Actionable Tip: Set an alert for when daily traffic exceeds 1,000 sessions to celebrate milestones and analyze what drove the spike.
User-Controlled Analytics for Beginners
While GA is powerful, obsessing over stats can be distracting, especially in your first year of blogging. Instead, focus on user-controlled analytics—metrics you can directly influence. Here are three to track:
- Posting Consistency:
- Why It Matters: Regular posting builds trust and keeps readers coming back. Consistent bloggers like Pinch of Yum have grown steadily by publishing weekly high-quality content.
- How to Track: Log your posting frequency (e.g., 1 post/week) and stick to a schedule.
- Actionable Tip: Define “consistent” for your schedule—daily, weekly, or monthly—and use a content calendar to stay on track.
- Amount Invested in Knowledge:
- Why It Matters: As a blogger, knowledge is your capital. Investing time and money in learning (e.g., SEO, photography) fuels growth.
- How to Track: Log 20–30 minutes daily spent on resources like Food Blogger Pro, cookbooks, or YouTube tutorials.
- Actionable Tip: Spend $20–$30 monthly on affordable resources, like a LinkedIn Learning course on video editing.
- Creator Ratio:
- Why It Matters: Spending more time creating content than consuming social media ensures you’re productive.
- How to Track: Divide time spent on social media by time spent creating (e.g., 1 hour social / 2 hours creating = 0.5). Aim for a ratio below 1.
- Actionable Tip: Use tools like Freedom to limit social media time and focus on recipe development.
Tools to Enhance Your Analytics Strategy
Google Analytics is just the start. These tools can complement GA and provide deeper insights:
Jetpack Stats ($5/month for 10,000 views)
- Features: Real-time data on traffic, popular posts, and referrers, integrated with WordPress.
- Why It’s Great: Beginner-friendly dashboard with clear visuals, ideal for quick checks.
- Actionable Tip: Use Jetpack’s “Top Posts” report to identify content for repurposing (e.g., turning a popular recipe into a video).
Microsoft Clarity (Free)
- Features: Heatmaps, session recordings, and user behavior insights like rage clicks.
- Why It’s Great: Visualizes how readers interact with your recipe cards and “Jump to Recipe” buttons.
- Actionable Tip: Use heatmaps to reposition recipe cards if readers struggle to find them.
Recipe Kit ($49/year)
- Features: SEO-optimized recipe cards, shoppable ingredients, and performance analytics.
- Why It’s Great: Enhances recipe visibility in search results and tracks engagement metrics like ingredient clicks.
- Actionable Tip: Add schema markup to recipes to appear in Google’s rich snippets, boosting CTR by up to 15%.
Pricing Table:
| Tool | Price | Key Features |
|---|---|---|
| Google Analytics | Free | Traffic, behavior, and conversion tracking |
| Jetpack Stats | $5/month (10k views) | Real-time traffic, top posts, referrers |
| Microsoft Clarity | Free | Heatmaps, session recordings |
| Recipe Kit | $49/year | SEO recipe cards, shoppable ingredients |
Best Practices for Using Google Analytics
To make the most of GA without feeling overwhelmed, follow these best practices:
- Check Analytics Sparingly: In your first year, review GA monthly to avoid obsession. Focus on creating content and learning.
- Set Clear Goals: Aim for specific outcomes, like increasing Pinterest traffic by 20% in 3 months.
- Analyze Top Performers: Study high-traffic posts to replicate their structure, visuals, or topics.
- Optimize Underperformers: Update low-traffic posts with better headlines, visuals, and SEO.
- Improve Page Speed: Use Jetpack Boost to keep load times under 2 seconds, reducing bounce rates.
- Craft Compelling Intros: Hook readers with surprising stats or questions (e.g., “Did you know 70% of home cooks struggle with weeknight dinners?”).
- Use Strategic CTAs: Place one or two CTAs per post, like “Download my free meal prep guide” to boost conversions.
Monetizing Your Food Blog with Analytics
Understanding your audience through GA can directly impact your revenue. Here’s how to use analytics for monetization:
- Advertising: High-traffic pages are ideal for ad placements via Google AdSense or Mediavine. Use GA’s Site Content report to identify these pages.
- Affiliate Marketing: Promote products (e.g., kitchen tools) on popular recipe posts. Track clicks with GA’s Events or affiliate dashboards.
- Sponsored Posts: Use traffic and engagement data to pitch brands, showing how your audience aligns with their target market.
- Email Newsletters: GA’s Conversions report tracks newsletter signups. Nurture subscribers with recipes and affiliate links.
Example Monetization Strategy:
- Popular Post: “Vegan Lasagna” (10,000 views/month).
- Action: Add affiliate links to a recommended lasagna pan and vegan cheese. Place a Mediavine ad above the recipe card.
- Result: Estimated $50–$100/month from ads and $20–$50 from affiliates, based on industry averages.
Conclusion
Google Analytics is a game-changer for food bloggers, offering insights that transform guesswork into growth. By focusing on key metrics like traffic sources, popular pages, and reader behavior, you can create content that resonates, optimize your site for SEO, and boost engagement. Tools like Jetpack Stats, Microsoft Clarity, and Recipe Kit complement GA, making it easier to act on data. Start small—set up GA, track the five core metrics, and review them monthly. As you grow, experiment with custom alerts, user-controlled analytics, and monetization strategies to take your food blog to new heights. Ready to dive in? Open your GA dashboard and start exploring today.
Please share this Google Analytics: A Beginner’s Guide for Food Bloggers with your friends and do a comment below about your feedback.
We will meet you on next article.
Until you can read, Writing for a Niche & Adding in Non-Recipe Content
