How to Understand your camera’s histogram
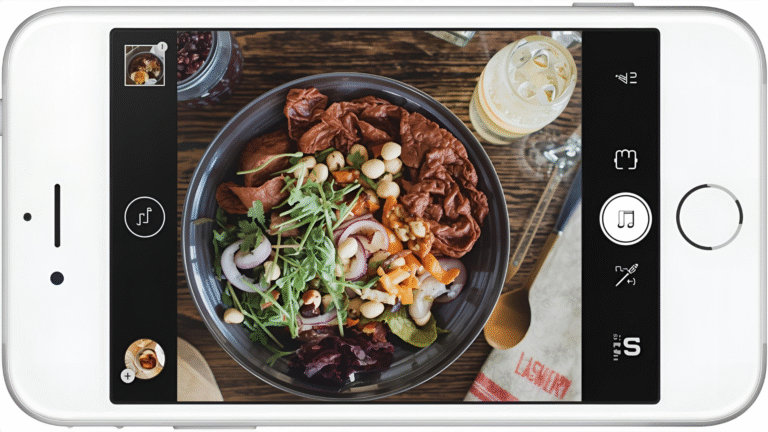
A histogram is one of the most powerful tools a photographer has, yet it’s one of the most ignored. Tucked into the back of your camera or embedded in Lightroom’s panels, this small graph quietly holds the key to consistent, well-exposed images. Once you understand what it’s telling you, you’ll stop guessing at exposure and start making deliberate, informed decisions every time you shoot.
What Is a Camera Histogram?
A histogram is a bar graph that maps the distribution of brightness values (tones) across your image. Every pixel in your photo is assigned a brightness value between 0 and 255—where 0 is pure black and 255 is pure white. The histogram plots all of those values simultaneously.
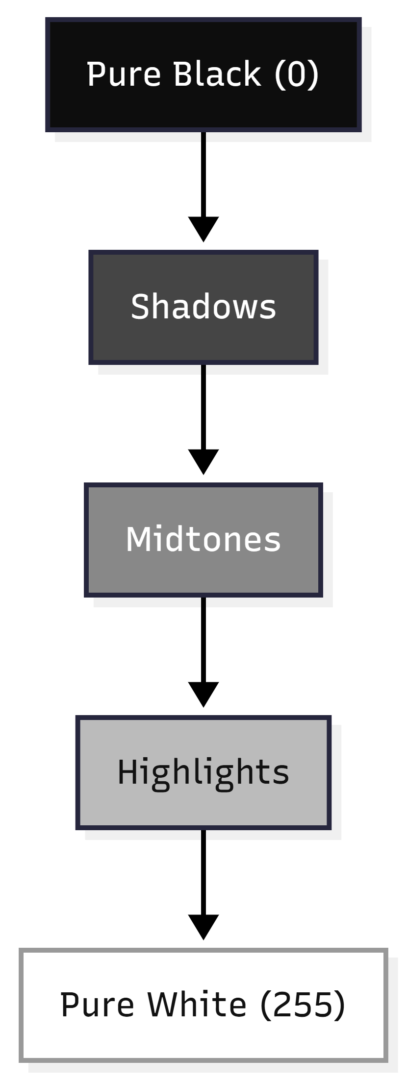
The horizontal axis (X-axis) represents brightness, organized left to right:
Pure Black → Shadows → Midtones → Highlights → Pure White
The vertical axis (Y-axis) represents the number of pixels at each brightness level. A tall column means many pixels share that brightness value. A short column means fewer.
The bars are packed together with no gaps, giving histograms their smooth, wave-like appearance. In color photography, the histogram is actually three overlapping graphs—red, green, and blue channels stacked on top of each other. Where all three overlap, the graph appears gray. Where two overlap, you’ll see cyan, yellow, or magenta.
The Anatomy of a Histogram
Understanding which part of the graph corresponds to which part of your image is the foundation of histogram literacy. A landscape photo with a bright sky will show a large hump on the right. A dark, moody close-up will show most of the graph weighted left. Neither is inherently “wrong”—the histogram is a description, not a verdict.
RAW vs. JPEG: An Important Distinction
Your camera’s built-in histogram is generated from the JPEG preview of your shot, even if you’re shooting RAW. This matters because:
| File Format | Brightness Levels Recorded | Editing Flexibility |
|---|---|---|
| JPEG (8-bit) | 256 levels | Limited recovery |
| RAW (12-bit) | 4,096 levels | Strong recovery |
| RAW (14-bit) | 16,384 levels | Maximum flexibility |
Because the in-camera histogram reflects the JPEG preview, it may show clipping that doesn’t actually exist in your RAW file. RAW files capture significantly more data in the shadows and highlights, giving you room to recover detail in post-processing that the JPEG preview suggests is lost. This is one of the strongest arguments for shooting in RAW format.
How to Read the Histogram
A Balanced Exposure
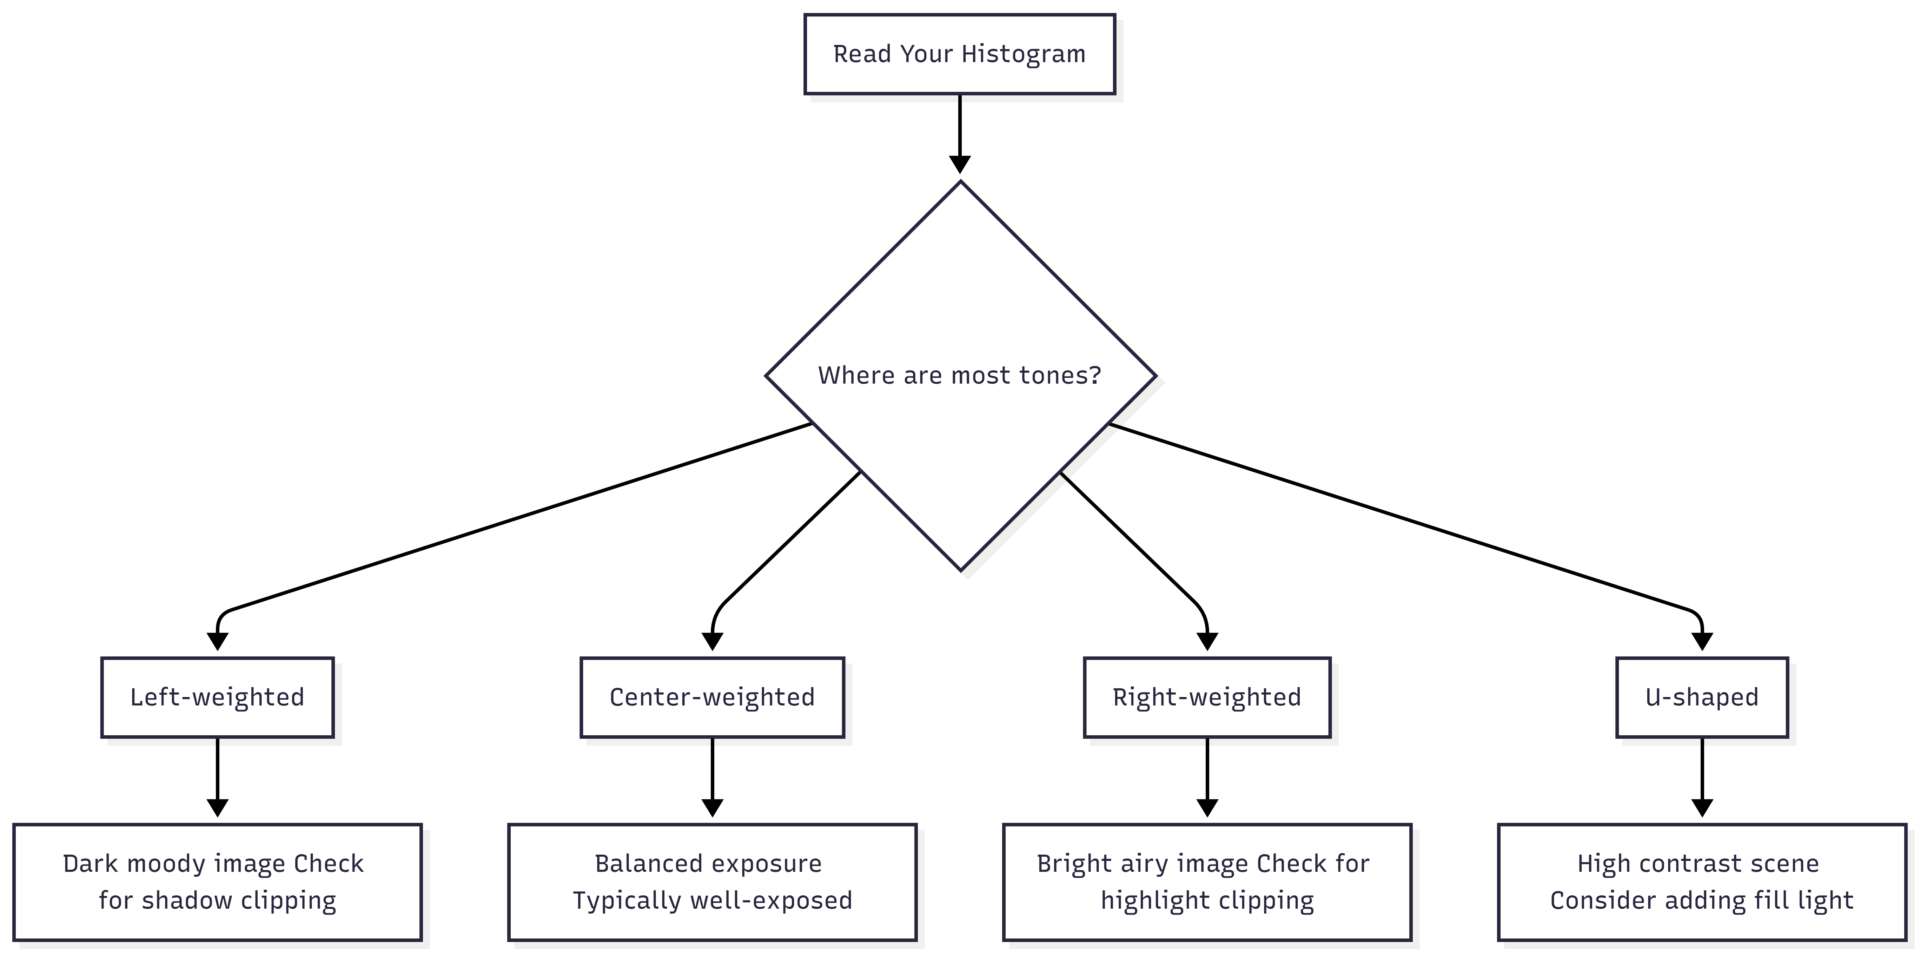
A well-exposed image in typical lighting conditions tends to show a graph with tones spread across the full range, with the peak near the center (midtones) and no hard spikes pressed against either edge. This indicates that detail exists throughout the image—in the shadows, midtones, and highlights alike.
Dark and Moody Shots
If you shoot in a deliberate low-key style—deep shadows, minimal highlights—your histogram will lean heavily to the left. This is not a mistake. It’s an intentional creative choice. The key is ensuring that the graph doesn’t slam hard against the left wall, which would indicate lost shadow detail rather than intentional darkness.
Bright and Airy Shots
High-key photography, common in food and lifestyle work, produces histograms weighted to the right. Again, the goal is to avoid hard clipping at the right edge, which would mean blown-out whites with no recoverable detail.
High-Contrast Scenes
Scenes with both very dark and very bright areas—such as a window behind a subject—produce a U-shaped histogram where the tones cluster at the extremes with minimal midtones. This tells you the scene has a dynamic range that may exceed your camera’s sensor capabilities. In this situation, you may need to add a reflector, adjust your lighting setup, or accept that some detail will be sacrificed.
Understanding Clipping
Clipping is what happens when tones exceed the sensor’s range and pile up at the absolute edges of the histogram. A spike hard against the left edge means shadow clipping—areas of the image are pure black with zero detail. A spike hard against the right edge means highlight clipping—areas are pure white with zero recoverable data.
Clipped tones cannot be recovered in post-processing, particularly in JPEG files. In RAW files, mild clipping can sometimes be rescued, but extreme clipping is permanent data loss.
Shadow Clipping
- Graph spikes against the far left edge
- Affected areas appear as solid, featureless black
- Common in backlit scenes or low-light situations
Highlight Clipping
- Graph spikes against the far right edge
- Affected areas appear as blank, blown-out white
- Common in scenes with bright light sources, reflective surfaces, or white subjects
When Clipping Is Acceptable
Clipping is not always a problem. If the sun appears in your frame, its highlights will clip—that’s expected and natural. If you’re shooting a dark product on a black background and want pure black negative space, shadow clipping may be intentional. The question isn’t whether clipping exists, but whether it’s harming the image you’re trying to make.
Histogram Shapes and What They Mean
| Histogram Shape | What It Indicates | Action |
|---|---|---|
| Bell curve centered | Balanced midtone exposure | Usually correct—verify visually |
| Weighted left | Dark/underexposed or intentional low-key | Check for shadow clipping |
| Weighted right | Bright/overexposed or intentional high-key | Check for highlight clipping |
| Hard left spike | Shadow clipping (lost detail in blacks) | Increase exposure or add light |
| Hard right spike | Highlight clipping (blown-out whites) | Decrease exposure or reduce light |
| U-shape | High contrast, wide dynamic range | Add fill light or adjust scene |
| Flat across | Very low contrast | May appear flat/dull |
Using Exposure Compensation with Your Histogram
Once you can read your histogram, you can use exposure compensation to correct it in real time. Exposure compensation (the +/- button on most cameras) lets you shift the histogram left or right without changing your shooting mode.
- If the histogram is bunched to the left (too dark): apply positive compensation (+0.3, +0.7, +1.0)
- If the histogram is bunched to the right (too bright): apply negative compensation (-0.3, -0.7, -1.0)
In manual mode, the same outcome is achieved by adjusting ISO, aperture, or shutter speed. The histogram responds to all exposure changes in real time on cameras with live histogram display.
RGB Histograms: The Next Level
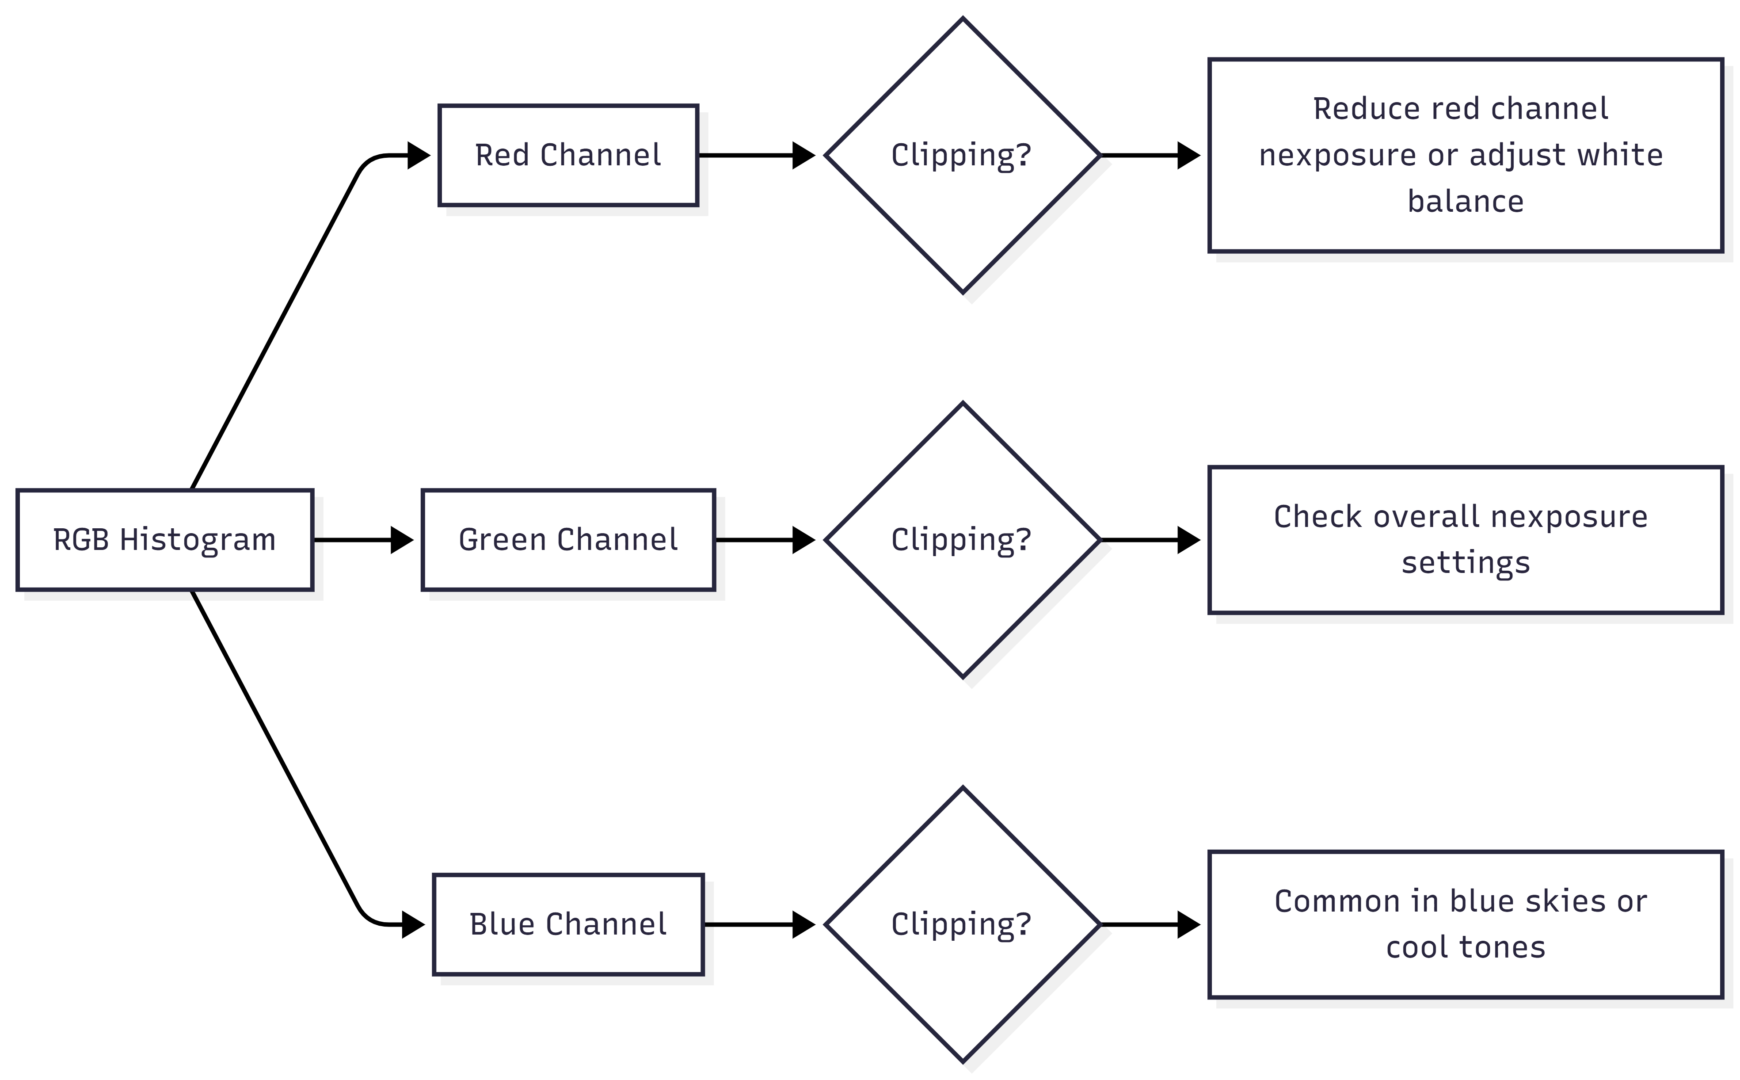
Most photographers start with the luminosity histogram (a single composite graph). But many cameras and editing programs also offer RGB histograms, which display the red, green, and blue channels separately.
This matters because a single channel can clip even when the overall histogram looks balanced. For example, photographing a bright red subject can blow out the red channel completely while the overall histogram appears fine. The result is a red area with no detail—a problem you’d miss entirely without examining the individual channels.
To check RGB histograms in Lightroom, hover over the histogram panel—the color channels appear distinctly. In-camera RGB histograms are accessible in the playback menu on most DSLRs and mirrorless cameras, though the exact navigation varies by brand.
Histograms in Lightroom and Capture One
When editing, your histogram becomes an interactive tool rather than just a readout.
Lightroom’s Clipping Warnings: Click the triangles in the upper corners of the histogram panel to activate highlight and shadow clipping overlays. When active:
- Red overlay on the image = blown-out highlights
- Blue overlay on the image = crushed shadows
- White triangle (upper right) = highlight clipping present
- White triangle (upper left) = shadow clipping present
Draggable Zones: In Lightroom, you can click and drag directly on the histogram to adjust blacks, shadows, exposure, highlights, and whites—five distinct tonal zones mapped across the histogram’s width.
Why Your LCD Screen Isn’t Enough
The LCD screen on your camera’s back is affected by ambient lighting, screen brightness settings, and the angle at which you’re viewing it. A screen in bright sunlight looks completely different from the same screen in a dim room, yet the actual image hasn’t changed. The histogram is immune to all of these variables. It shows you what’s in the file—not what the screen makes it look like.
This is especially critical when shooting tethered. Even on a calibrated laptop monitor, ambient light and screen settings can mislead your perception of exposure. The histogram tells you the truth regardless of viewing conditions.
Developing Consistency Through Histograms
One often-overlooked benefit of studying your histograms is the consistency it builds over time. Photographers who develop a strong personal style tend to produce images with recognizable tonal characteristics. If you shoot bright, airy food photography, your histograms will consistently show a right-weighted distribution. If you shoot dark and moody portraits, your histograms will lean left with deep shadows.
By reviewing histograms from your favorite images—the ones that best represent your style—you build a mental model of what your target exposure looks like as data, not just as a visual impression. Over time, a glance at the histogram tells you whether a shot is on-brand before you even look at the image itself.
Common Mistakes and How to Fix Them
- Trusting the LCD instead of the histogram: The screen lies. The histogram doesn’t. Check both, but rely on the histogram for exposure decisions.
- Chasing a “perfect” bell curve: There is no universally correct histogram shape. The right histogram for your image depends entirely on your creative intent and the scene you’re shooting.
- Ignoring individual color channels: A composite histogram can look balanced while a single channel is severely clipped. Always check RGB channels when shooting highly saturated subjects.
- Not using live histogram mode: Most modern mirrorless and DSLR cameras support real-time histograms in live view. Enabling this lets you see the impact of every exposure adjustment before you shoot.
- Over-relying on clipping recovery in post: While RAW files offer significant latitude, pushing heavily underexposed or overexposed images introduces noise, color shifts, and loss of microcontrast. Getting exposure right in camera is always faster and produces better results.
Summary
The histogram is one of the most reliable tools available to photographers at every level. It removes ambiguity from exposure decisions, confirms whether detail exists in your shadows and highlights, and helps you build a consistent visual style over time.
Reading a histogram comes down to three principles: understand that brightness runs left to right; watch for spikes pressed against either edge (clipping); and remember that no single histogram shape is universally correct—what matters is whether the tones in your specific image are capturing the detail and mood you intended.
Turn on your camera’s histogram view today, check the shape after every shot, and cross-reference with your LCD rather than relying on it alone. Within a few sessions, reading a histogram will become second nature—and your exposure consistency will show it.
Please share this How to Understand your camera’s histogram with your friends and do a comment below about your feedback.
We will meet you on next article.
Until you can read, Protein-Packed Oatmeal with Chia Seeds and Almond Milk