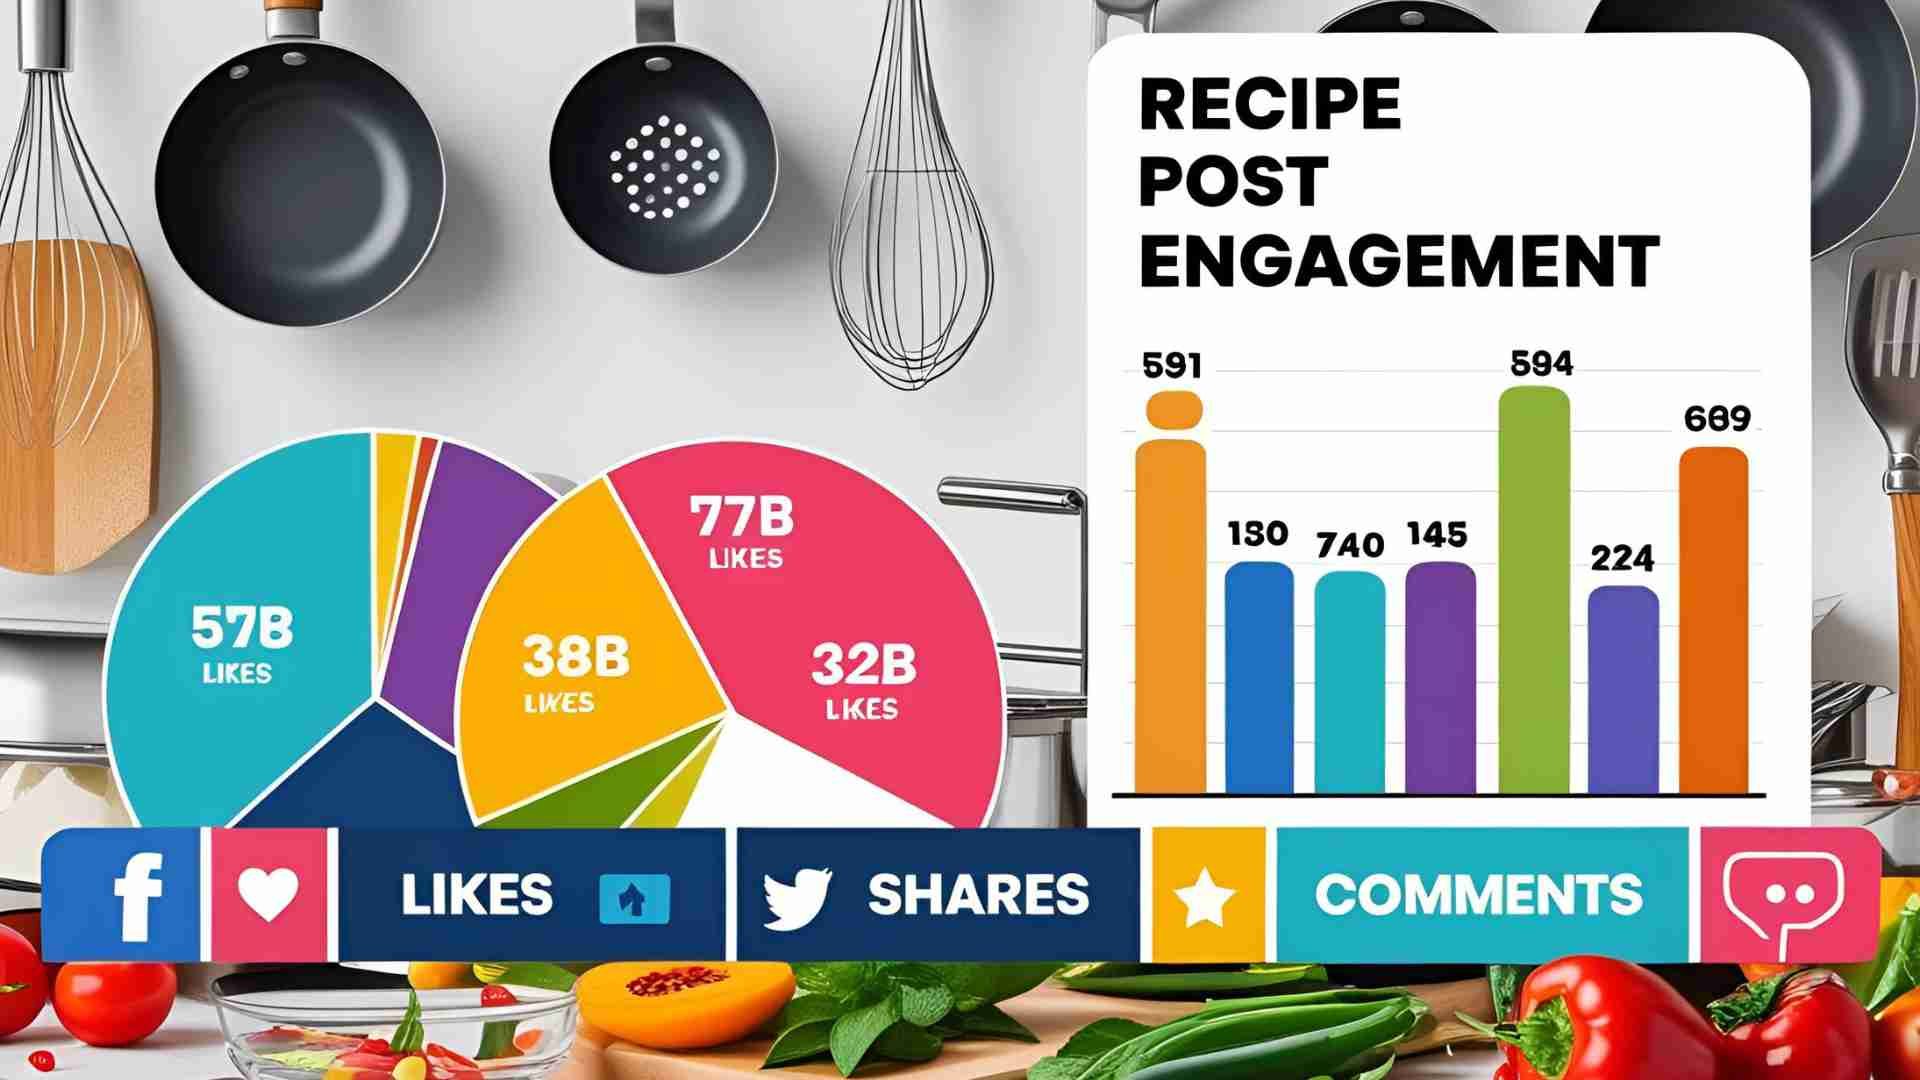
Top Metrics for Recipe Post Engagement
Discover key metrics for boosting recipe post engagement on social media. Learn how to track, analyze, and optimize content to enhance your food blog’s performance.
In the dynamic world of food blogging, creating mouthwatering recipes is only half the battle. To truly succeed, you need to understand how your audience interacts with your content. Social media metrics provide the data-driven insights necessary to refine your strategy, boost engagement, and increase revenue. This guide explores the top metrics for recipe post engagement, offering actionable strategies to optimize your food blog’s performance and stand out in a competitive digital landscape.
Why Social Media Metrics Matter for Food Bloggers
Social media metrics are critical for food bloggers because they reveal how your audience engages with your recipes, from initial impressions to shares and conversions. These data points help you understand what resonates with your readers, allowing you to tailor content to their preferences. According to industry insights, over 50% of business leaders use social media data to inform broader strategies, underscoring its value beyond mere engagement. For food bloggers, metrics can highlight opportunities to improve content, attract advertisers, and enhance monetization efforts.
Without metrics, you’re cooking without a recipe—guessing what works instead of knowing. By tracking key performance indicators (KPIs), you can optimize your blog’s layout, refine your social media strategy, and demonstrate your value to sponsors. This article dives into the essential metrics for recipe post engagement, how to measure them, and how to leverage tools like the Clarity Recipe Widget to elevate your blog.
Understanding Social Media Metrics for Recipe Posts
Social media metrics are quantifiable data points that track the performance of your content across platforms like Instagram, Pinterest, Twitter, and Facebook. For recipe posts, these metrics focus on how users interact with your recipes, from viewing a post to clicking the “Jump to Recipe” button or sharing your content. They provide insights into audience behavior, content effectiveness, and business impact.
Key Benefits of Tracking Metrics
- Identify Audience Preferences: Understand which recipes or formats (e.g., videos, carousels) drive the most engagement.
- Optimize Content Layout: Discover if users are finding your recipe cards quickly or getting lost in lengthy posts.
- Boost Monetization: Use engagement data to attract advertisers and negotiate better deals.
- Uncover New Opportunities: Spot emerging trends or audience segments to expand your reach.
For food bloggers, metrics are the ingredients that bring your content strategy to life. Let’s explore the top metrics to prioritize.
Top 10 Metrics for Recipe Post Engagement
The following metrics are tailored to food bloggers aiming to enhance engagement and grow their audience. Each metric provides unique insights into how your recipes perform and how you can optimize your content.
1. Follower Growth
Follower growth measures the net new followers gained over a specific period. It’s a key indicator of your blog’s ability to attract and retain an audience.
- Why It Matters: A growing follower base signals increasing brand awareness and content appeal. For food bloggers, this metric shows whether your recipes are resonating enough to draw new readers.
- How to Measure: Subtract the number of followers at the start of a period from the current count. For example, if you had 10,000 followers on January 1 and 10,500 on January 31, your net growth is 500 followers.
- Formula:
Follower Growth = Current Followers - Initial Followers- Actionable Tip: Use tools like Sprout Social’s Instagram Profile Report to visualize growth trends and correlate them with specific recipe posts or campaigns.
2. Follower Growth Rate
This metric expresses follower growth as a percentage, showing how quickly your audience is expanding relative to its size.
- Why It Matters: A high growth rate indicates that your recipe content is attracting new followers at a sustainable pace. It’s particularly useful for comparing performance across platforms.
- How to Measure: Divide the number of new followers by the initial follower count, then multiply by 100. For example, gaining 200 followers from 10,000 yields a 2% growth rate.
- Formula:
Follower Growth Rate = (New Followers / Initial Followers) x 100- Actionable Tip: Experiment with trending recipe formats (e.g., short-form videos on TikTok) to boost growth rate, and track results using platform analytics.
3. Impressions
Impressions measure how many times your recipe post is displayed, regardless of whether it’s clicked or engaged with.
- Why It Matters: High impressions indicate strong visibility, which is crucial for building brand awareness. For recipe posts, this metric shows how often your content appears in users’ feeds.
- How to Measure: Most platforms (e.g., Instagram, Twitter) provide impression data in their analytics dashboards. TikTok’s “total video views” is equivalent to impressions.
- Actionable Tip: Increase impressions by posting during peak audience activity times, which you can identify using tools like TikTok Analytics or Sprout Social.
4. Reach
Reach counts the number of unique users who see your recipe post, offering insight into your content’s potential audience.
- Why It Matters: Unlike impressions, which may count multiple views by the same user, reach shows how many individuals your recipes are reaching. This is vital for assessing brand awareness.
- How to Measure: Check reach in platform-specific analytics (e.g., Meta Business Suite for Instagram and Facebook). For example, if a post reaches 5,000 unique users, that’s your reach.
- Actionable Tip: Use hashtags relevant to your niche (e.g., #HealthyRecipes, #VeganDesserts) to expand reach to new audiences.
5. Engagement Rate
Engagement rate measures how actively your audience interacts with your recipe posts through likes, comments, shares, and other actions.
- Why It Matters: A high engagement rate signals that your recipes resonate with your audience, fostering community and loyalty. For food bloggers, this metric highlights which recipes spark conversation.
- How to Measure: Divide total engagements (likes, comments, shares) by impressions or reach, then multiply by 100. Industry benchmarks suggest an average engagement rate of 1-5% for recipe content.
- Formula:
Engagement Rate = (Total Engagements / Impressions or Reach) x 100- Actionable Tip: Encourage engagement by asking questions in your captions (e.g., “What’s your favorite ingredient to add to this dish?”) and responding to comments promptly.
6. Comments
Comments provide qualitative insights into how your audience perceives your recipes, offering feedback on content quality and user experience.
- Why It Matters: Comments reveal what your audience loves or dislikes about your recipes, helping you refine your approach. They also boost post visibility on algorithm-driven platforms.
- How to Measure: Track the number of comments per post using platform analytics or tools like Sprout Social.
- Actionable Tip: Use session recordings from the Clarity Recipe Widget to see how users navigate to the comment section and identify barriers to engagement.
7. Shares
Shares track how often users share your recipe posts with their followers, amplifying your content’s reach.
- Why It Matters: Shares indicate that your recipes are compelling enough for users to recommend to others, boosting organic growth and brand awareness.
- How to Measure: Monitor share counts in platform analytics (e.g., Instagram’s “Send” button, Twitter retweets).
- Actionable Tip: Create shareable content like visually stunning recipe videos or infographics to encourage users to share with their networks.
8. Video Completion Rate
This metric measures the percentage of viewers who watch your recipe videos from start to finish.
- Why It Matters: A high completion rate indicates that your video content is engaging and holds attention, which is critical for platforms like TikTok and Instagram Reels.
- How to Measure: Check video completion data in platform analytics or use tools like Sprout Social to track view duration.
- Actionable Tip: Keep recipe videos concise (under 60 seconds) and front-load key steps to maintain viewer interest.
9. Click-Through Rate (CTR)
CTR compares the number of clicks on a link in your recipe post (e.g., to your blog) to the number of impressions.
- Why It Matters: For food bloggers, CTR shows how effectively your social posts drive traffic to your website, where monetization opportunities like ads and affiliate links reside.
- How to Measure: Divide clicks by impressions and multiply by 100. For example, 100 clicks from 10,000 impressions yield a 1% CTR.
- Formula:
CTR = (Clicks / Impressions) x 100- Actionable Tip: Use clear calls-to-action (e.g., “Click to get the full recipe!”) and track clicks with UTM parameters in Google Analytics.
10. Social Media Referral Traffic
This metric tracks the number of website visitors arriving from social media platforms.
- Why It Matters: Referral traffic shows how effective your social media strategy is at driving users to your blog, where they can engage with recipe cards and generate ad revenue.
- How to Measure: Use Google Analytics to monitor traffic sources, filtering for social media referrals. Add UTM codes to links for precise tracking.
- Actionable Tip: Optimize your blog’s recipe cards for quick loading and mobile-friendliness to retain social media visitors.
Leveraging the Clarity Recipe Widget for Deeper Insights
The Clarity Recipe Widget is a powerful tool for food bloggers, offering detailed analytics on how users interact with recipe posts and cards. Unlike standard analytics platforms, it provides granular insights into user behavior, helping you optimize content and boost engagement.
Key Features of the Clarity Recipe Widget
- Session Tracking: Monitors the number of sessions on recipe posts, showing how often users visit and engage with your content.
- Click Analysis: Tracks clicks on elements like the “Jump to Recipe” button, revealing how easily users find key content.
- Heatmaps: Visualizes where users click and scroll, helping you identify areas of high or low engagement.
- Session Recordings: Allows you to watch how users navigate your posts, pinpointing friction points in the user experience.
How to Use the Clarity Recipe Widget
- Install the Widget: Integrate Clarity with your blog platform (e.g., WordPress) to start tracking user interactions.
- Analyze Recipe Post Metrics: Monitor sessions, clicks, and related recipe views to understand content performance.
- Optimize Recipe Cards: Use heatmap data to adjust the placement or design of recipe cards for better visibility.
- Refine Traffic Strategies: Compare organic vs. social media traffic to prioritize high-performing channels.
Pricing
- Free Tier: Basic analytics, including session tracking and heatmaps, suitable for small blogs.
- Pro Plan: $10/month, includes advanced features like session recordings and detailed click analysis.
- Enterprise Plan: Custom pricing, offers API access and premium support for large-scale blogs.
Visualizing Metrics with Mermaid Charts
To help visualize your recipe post engagement strategy, consider using Mermaid charts to map out your metrics and their impact on business goals. Below is a sample flowchart illustrating how metrics contribute to engagement and revenue.

This chart shows the flow from impressions to monetization, highlighting how engagement metrics like comments and shares feed back into content optimization.
Monetizing Your Food Blog with Metrics
Understanding engagement metrics can significantly enhance your blog’s monetization potential. Here’s how:
1. Advertising
- How Metrics Help: High engagement rates and referral traffic demonstrate your blog’s value to advertisers, justifying higher ad rates.
- Strategy: Use Google AdSense or direct ad placements, showcasing metrics like impressions and CTR to attract premium advertisers.
- Example: A blog with 100,000 monthly impressions and a 2% CTR can command higher rates than one with lower engagement.
2. Affiliate Marketing
- How Metrics Help: Tracking clicks and conversions from affiliate links shows which products resonate with your audience.
- Strategy: Promote kitchen tools or ingredients relevant to your recipes, using CTR and referral traffic data to select high-performing affiliate programs.
- Example: If a recipe post with an affiliate link for a stand mixer generates 500 clicks and 50 conversions, you can prioritize similar products.
3. Sponsored Posts
- How Metrics Help: Metrics like reach and engagement rate prove your influence to brands, securing sponsored content deals.
- Strategy: Collaborate with food brands, using data to highlight your audience’s engagement with recipe content.
- Example: A post with 10,000 reach and 500 comments can attract brands looking for high-visibility partnerships.
Best Practices for Tracking and Reporting Metrics
To maximize the impact of your metrics, follow these best practices:
1. Create a Metrics Glossary
Define each metric (e.g., impressions, CTR) and its relevance to your blog’s goals. Share this glossary with your team to ensure alignment.
2. Use Data Storytelling
Combine metrics to tell a compelling story about your blog’s performance. For example, highlight how a high engagement rate led to increased ad revenue during a campaign.
3. Establish a Reporting Cadence
- Monthly Reports: Track short-term metrics like engagement rate and CTR to adjust content strategies.
- Quarterly Reports: Analyze follower growth and referral traffic to assess long-term progress.
- Annual Reports: Evaluate overall monetization and audience growth to set new goals.
4. Revisit Metrics Regularly
As your blog evolves, your KPIs may change. For example, if you shift from organic to paid social media, prioritize metrics like cost per click (CPC) and return on ad spend (ROAS).
5. Use Automation Tools
Manual tracking is time-consuming. Use tools like Sprout Social, Google Analytics, and the Clarity Recipe Widget to automate data collection and reporting.
Tools for Tracking Recipe Post Metrics
Here are the top tools to streamline your metrics tracking:
- Sprout Social: Centralizes analytics for multiple platforms, offering reports on engagement, reach, and impressions. Pricing starts at $99/month.
- Google Analytics: Tracks referral traffic and website conversions. Free to use with optional premium features.
- Meta Business Suite: Provides insights for Instagram and Facebook, including engagement and demographic data. Free with a Meta account.
- TikTok Analytics: Monitors video views and engagement for short-form recipe content. Free for business accounts.
- Clarity Recipe Widget: Offers specialized analytics for recipe posts, including heatmaps and session recordings. Pricing ranges from free to custom enterprise plans.
Case Study: Boosting Engagement with Metrics
Consider a food blogger who noticed low engagement on their Instagram recipe posts. Using the Clarity Recipe Widget, they discovered that users were scrolling past lengthy captions to reach the recipe card. By moving the “Jump to Recipe” button higher in the post, they increased clicks by 30% and referral traffic by 15%. Additionally, analyzing comments revealed a demand for vegan recipes, prompting the blogger to create a vegan series that boosted follower growth by 5% in one month.
Final Thoughts
Tracking the right metrics is the key to transforming your food blog from a passion project to a revenue-generating powerhouse. By focusing on metrics like engagement rate, referral traffic, and video completion rate, you can optimize your content, attract advertisers, and build a loyal audience. Tools like the Clarity Recipe Widget provide the granular insights needed to refine your strategy, while platforms like Sprout Social and Google Analytics offer a broader view of your performance.
Start by implementing the Clarity Recipe Widget to gain deeper insights into user behavior, then use the metrics outlined in this guide to craft a data-driven content strategy. With consistent tracking and optimization, your food blog can achieve “egg-strordinary” success in the flavorful world of digital content.
Please share these Top Metrics for Recipe Post Engagement with your friends and do a comment below about your feedback.
We will meet you on next article.
Until you can read, How to Create Recipe PDF Books: 5 Steps


